Overview
Canis is a high-level grammar for animations. It provides an easy-understanding JSON syntax, and generates multi-view animations of the given visualization charts to support storytelling or analysis. Canis can describe and create animations in a declarative format. To use Canis, our compiler compiles the specification into a corresponding relation between time and visual attributes of the graphical marks in charts. Then it generates Lottie JSON file to enable rendering natively on iOS, Windows, and Web.
This document describes the syntax of Canis and how to use it in web applications.
Canis
Canis specification is a JSON object that describes a diverse range of animations of the given visualization charts.
The specification has three parameters:
| Property | Type | Description |
|---|---|---|
| charts | Array |
Required. An array of chart objects that describes the input visualization charts used to generate animations.. |
| facet | Object |
An facet object to create multiple animation views and describes charts belong to each view. |
| animations | Array |
An array of animation objects |
//Top-level View Specification
{
    "charts" : [...],
    "facet" : ...,
    "animations" : [...]
}
Chart-Level Spec
Specificaitons that describe the sources, grouping according to facet views, and animations of the input visualization charts.
Chart Object
A chart object describes one input
visualization chart used to
generate animations.
For example, import a line chart.
{
    "source" : "./lineChart.dsvg"
}
A chart object can contain the following properties:
| Property | Type | Description |
|---|---|---|
| id | String |
Pick an id for the visualization chart given by |
| source | String |
Required. Fetches the visualization chart file at the specified input URL |
| start | Number |
Start index of the input files |
| end | Number |
End index of the input files |
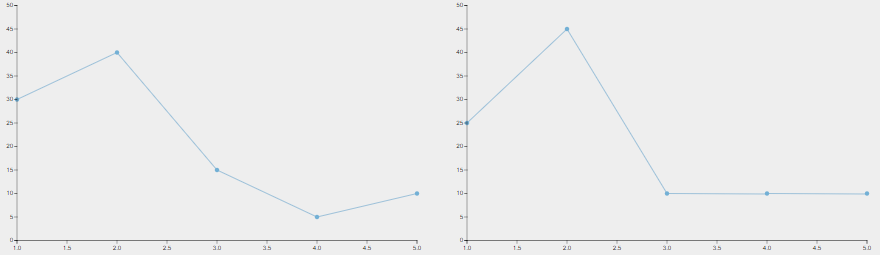
For example, we can pick an id for the chart (form lineChart0.dsvg to lineChart10.dsvg).
{
    "id" : "lineChart",
    "source" : "./lineChart.dsvg"
}
Or, we can import a series of charts.
{
    "source" : "./lineChart",
    "start" : 0,
    "end" : 10
}
//Top-level View Specification
{
    "charts" : [
        {...},
        ...
    ],
    ...
}
Facet Object
The facet object facets views for multi-view animation. We can then specify
charts
for each view to generate animations.
{
    "charts" : [
        {
            "id" : "lineChart1",
            "source" : "./lineChart1.dsvg"
        },
        {
            "id" : "lineChart2",
            "source" : "./lineChart2.dsvg"
        }
    ],
    "facet" : {
        "type" : "column",
        "views" : [
            {"frames": ["lineChart1"]},
            {"frames":["lineChart2"]}
        ]
    },
    ...
}
A facet object can contain the following properties:
| Property | Type | Description |
|---|---|---|
| type | String |
How to layout the views. One of Default value is |
| views | Array |
An array of view objects specifying which charts belong to each view. Each object can
have either of the following attributes: |
//Top-level View Specification
{
    "charts" : [...],
    "facet" : {...},
    ...
}
Animation Object
An Animation object describes the animations of charts. It selects marks from the chart
by selection, animations described by this animation object will be bind to those
marks. grouping decides the minimum unit during animaiton (marks that animate
together), and their timing relations. And actions specify animation parameters like
type of animation, duration of the animation of each unit, and so on.
| Property | Type | Description |
|---|---|---|
| offset | Number or Object |
The offset time before this animation. One of: 1) number indicates time in ms or 2) offset object. |
| reference | String |
Specify the order of this animation. One of
Default value is |
| selection | String |
Required. Selectors to select marks from the chart. |
| grouping | Object |
A grouping object that decides the minimum unit during animtion. |
| actions | Array |
An array of action objects that sepcifies animations parameters like type of animation, duration of the animation of each unit, and so on. |
//Top-level View Specification
{
    "charts" : [...],
    "facet" : {...},
    "animations" : [
        {...},
        ...
    ]
}
Mark-Level Spec
These are the parameters of the animation object.
Selection
Borrowing form CSS 1-3, Canis provides a set of tools for matching marks in given charts. The W3C CSS specification contains the complete set of rules regarding valid CSS selectors.
{
"selection" : ".dot",//select marks with the class name as "dot".
...
}
Here we list some of the commonly used selectors:
-
Class Selector (".class")
Select all marks which have the given class name.
-
ID Selector ("#id")
Select the mark the given id.
-
All Selector ("*")
Select all the marks.
-
Element Selector ("tag")
Select all marks which have the given tag name.
-
Attribute Equals Selector ([name="value"])
Select all marks whose values of the given attribute are equal to a certain given value.
-
Multiple Selector ("selector1, selector2, selectorN")
Select all marks with all the specified selectors.
Grouping Object
A grouping object groups the selected marks by attributes of the data they encoded in a
hierarchical manner. Each group is a minimum animation unit, and marks within the same unit will be
animated together. The timing relationships between units like animation order, delay are also
specified.
{
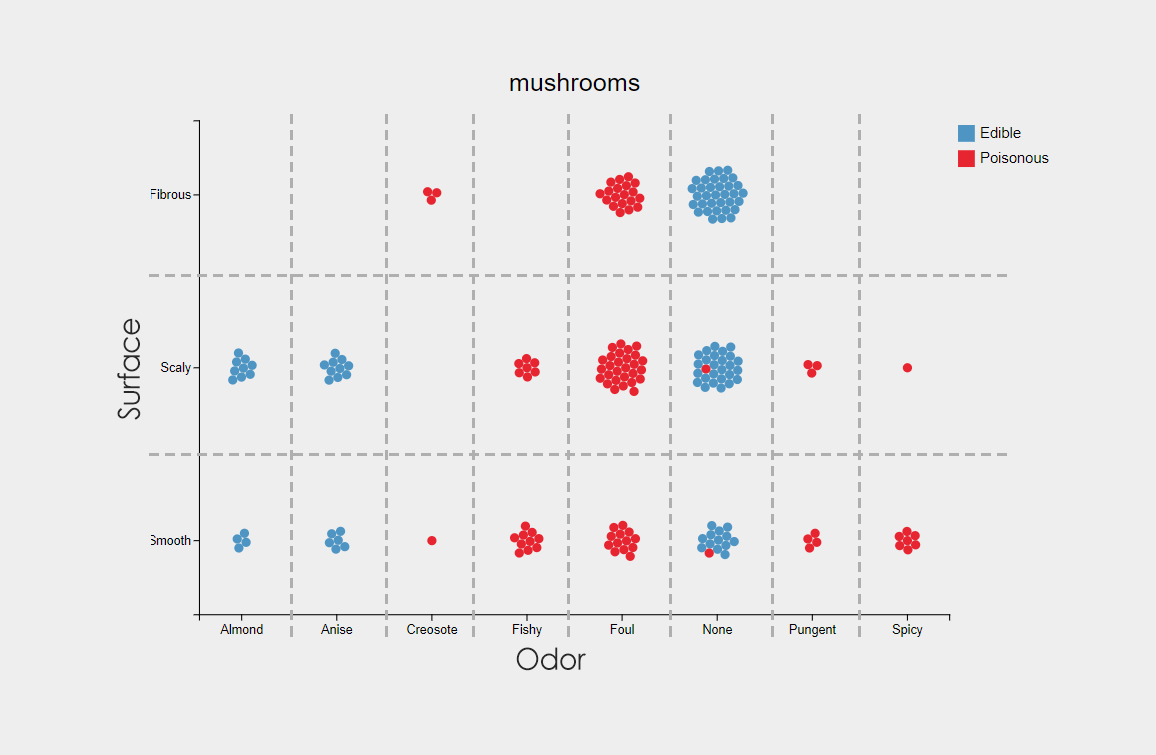
"selection" : ".dot",//all marks are selected.
//the following code groups dots into cells as shown in the figure.
"grouping" : {
"groupBy" : "Odor",//all dots will be grouped into columns.
"reference" : "previousEnd",//animate column after column.
"grouping" : {
"groupBy" : "Surface",//dots in each column are further grouped into rows.
"reference" : "previousEnd",//animate row after row.
}
},
...
}
A grouping object can contain the following parameters:
| Property | Type | Description |
|---|---|---|
| groupBy | String |
Categorical data attributes or Default value is |
| reference | String |
Specify the aniamtion order of the resulted groups. One of
Default value is |
| delay | Number |
Time delays between groups. |
| sort | Object |
A sort object that specifies the animation order of the resulted groups. |
| grouping | Object |
A nested grouping object that specifies the further grouping of the resulted groups. |
//Top-level View Specification
{
    "charts" : [...],
    "facet" : {...},
    "animations" : [
        {
            "selection" : ...,
            "grouping" : {...},
            ...
        },
        ...
    ]
}
Sort Object
A sort object specifies the animation order of the mark groups.
//groups will be animated with their value of "attr" in ascending order
{
    "field" : "attr",
    "order" : "ascending"
}
A sort object can contian the following parameters:
| Property | Type | Description |
|---|---|---|
| field | String |
Data attributes or |
| order | String or Array |
Specify the order of the values of the attribute selected in Default value is |
Action Object
An animation can have multiple actions. For example the marks can wipe in from bottom
while they wipe
in from left. An action object describe parameters of one action, including type,
easing, duration, order, and timing offset of the action.
{
    "type" : "fade",
    "easing" : "easeOutBounce",
    "duration" : 1000//ms
}
An action can contain the following parameters:
| Property | Type | Description |
|---|---|---|
| type | String |
Required. Type of the action. One of |
| offset | Number or Object |
The offset time before this action. One of: 1) number indicates time in ms or 2) offset object. |
| reference | String |
Specify the order of this action. One of
Default value is |
| easing | String |
Specify the easing function. One of Default value is |
| duration | Number or Object |
The duration time of this action. One of: 1) number indicates time in ms or 2) duration object. |
| attribute | Object |
When choosing |
For example we can animate marks with the same duration:

    {
        "selection" : ".Shape2",
        "actions" : [
            {
                "type" : "wipe bottom",
                "duration" : 1000
            }
        ]
    }
Or we can control the animation speed by defining the minimum duration time with duration object:
    {
        "selection" : ".Shape2",
        "actions" : [
            {
                "type" : "wipe bottom",
                "duration" : {
                    "field" : "percentage",
                    "minDuration" : 300
                }
            }
        ]
    }
//Top-level View Specification
{
    "charts" : [...],
    "facet" : {...},
    "animations" : [
        {
            "selection" : ...,
            "grouping" : {...},
            "actions" : [
                {...},
                ...
            ]
        },
        ...
    ]
}
Offset Object
An offset object defines the offset time of marks according to the values of one of
their data attributes.
For example, marks selected have a data attribute called "attr" with its values ranging from 10 to 100, we define the minimum offset time as 200ms, then the offset time of the mark whose "attr" value is 10 will be 200ms, and the one whose "attr" value is 100 will be 2,000ms. The example code is shown below:
{
    "field" : "attr",
    "minOffset" : 200
}
An offset object can contian the following parameters:
| Property | Type | Description |
|---|---|---|
| field | String |
Required. Data attribute. |
| minOffset | Number |
The offset time of the mark with minimum value of the specified data attribute. |
Duration Object
A duration object defines the duration time of marks according to the values of one of
their data
attributes.
For example, marks selected have a data attribute called "attr" with its values ranging from 10 to 100, we define the minimum duration as 200ms, then the duration of the mark whose "attr" value is 10 will be 200ms, and the one whose "attr" value is 100 will be 2,000ms. The example code is shown below:
{
    "field" : "attr",
    "minDuration" : 200
}
A duration object can contian the following parameters:
| Property | Type | Description |
|---|---|---|
| field | String |
Required. Data attribute. |
| minDuration | Number |
The duration of the mark with minimum value of the specified data attribute. |
Attribute Object
An attribute object picks one of the visual parameters and defines the start and end
value of this parameter using percentages.
{
    "attrName" : "attr",
    "from" : 0,
    "to" : 1
}
An attribute object can contian the following parameters:
| Property | Type | Description |
|---|---|---|
| attrName | String |
Required. Data attribute. |
| from | Number |
The start value of the specified data attribute using percentages. Ranging from 0 to 1. |
| to | Number |
The end value of the specified data attribute using percentages. Ranging from 0 to 1. |
Web Application
We can use the following snippet to link to the latest release:
<script src="http://www.njvis.net/CanisWeb/anichart.min.js"></script>"
We can create an animated visualization on the web page using the following code:
<div id='chartContainer'></div>
<div id='videoContainer'></div>
<script>
    aniChart.loadSpec('./specs/line2.ac', (spec) => {
        aniChart.renderSpec(spec);
        aniChart.play();
    })
</script>
Canis provides the following variables and functions to create or customize animations.
aniChart.loadSpec()
This function fetches the AC format spec file at the specified input URL and returns the spec as a JSON object.
aniChart.loadSpec('./spec.ac', (spec) => {
    console.log(spec);
})
aniChart.renderSpec(spec)
This function renders the animation using the input spec.
aniChart.play()
Call this function to play the rendered animation.
The following functions and variables can be used to create a customized animation player:
aniChart.frameRate
This is the frame rate of the animation.
console.log(aniChart.frameRate);//25
aniChart.duration()
This is the duration time of the entire animation.
console.log(aniChart.duration());//1000
aniChart.renderFrame(time)
This returns the visual effects of all the marks at a specific time point.
aniChart.renderFrame(300);//render the frame at 300ms
aniChart.reset()
Reset all status.